R/plot_dna.R
plot_dna.Rd
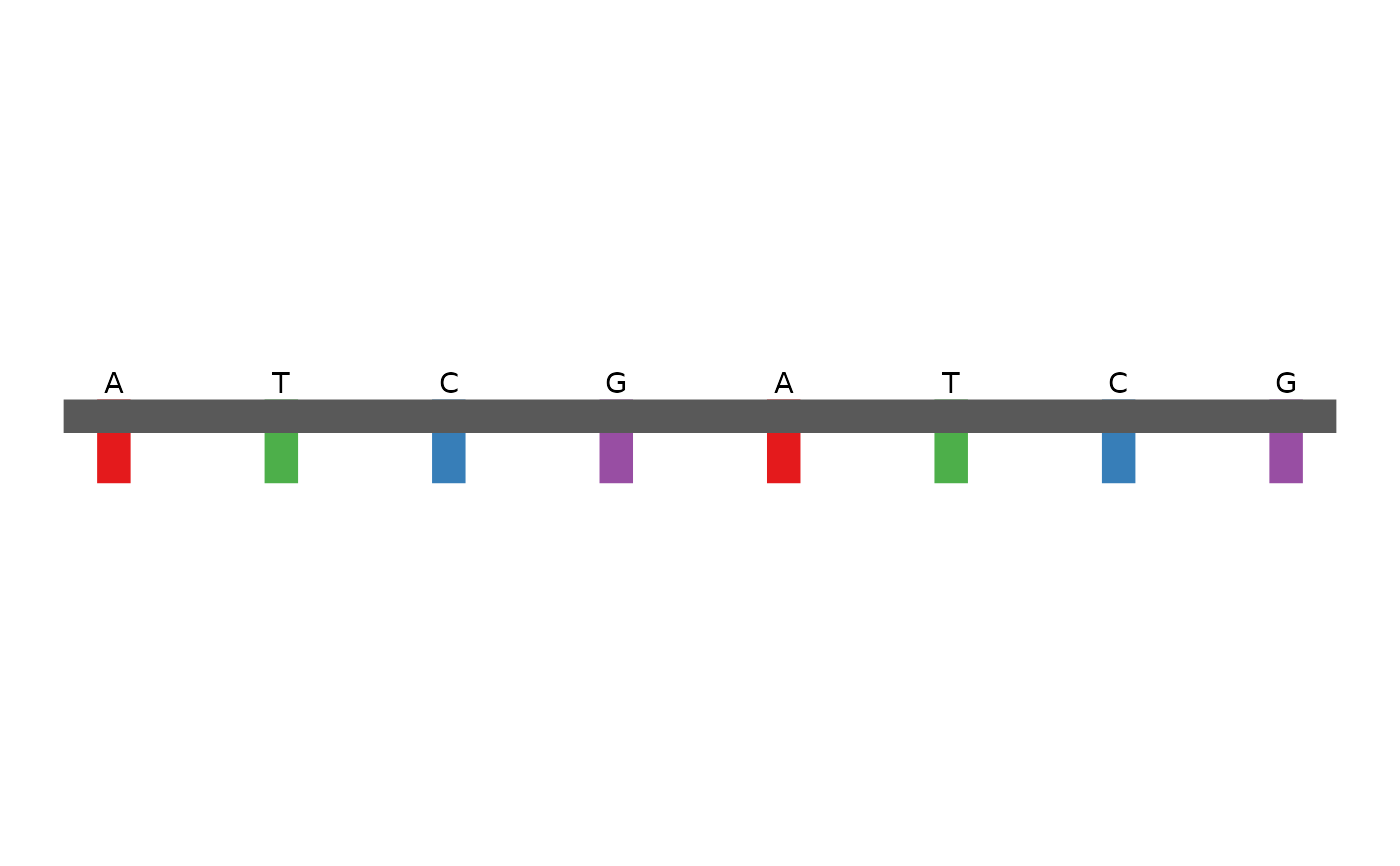
Creates a plot of a DNA sequence, with each base represented by a colored rectangle.
plot_dna(seq)
A character string representing the DNA sequence.
A ggplot2 object representing the DNA sequence plot.
ggplot2
seq <- "ATCGATCG"
plot_dna(seq)
#> ℹ Plotting 8 bases