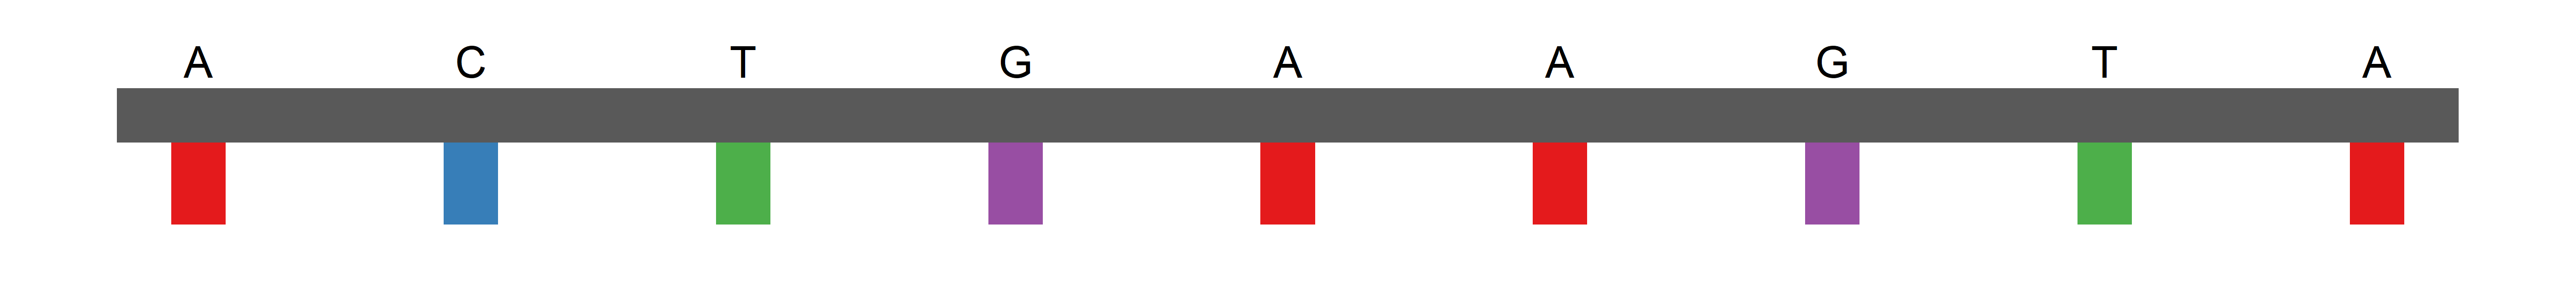
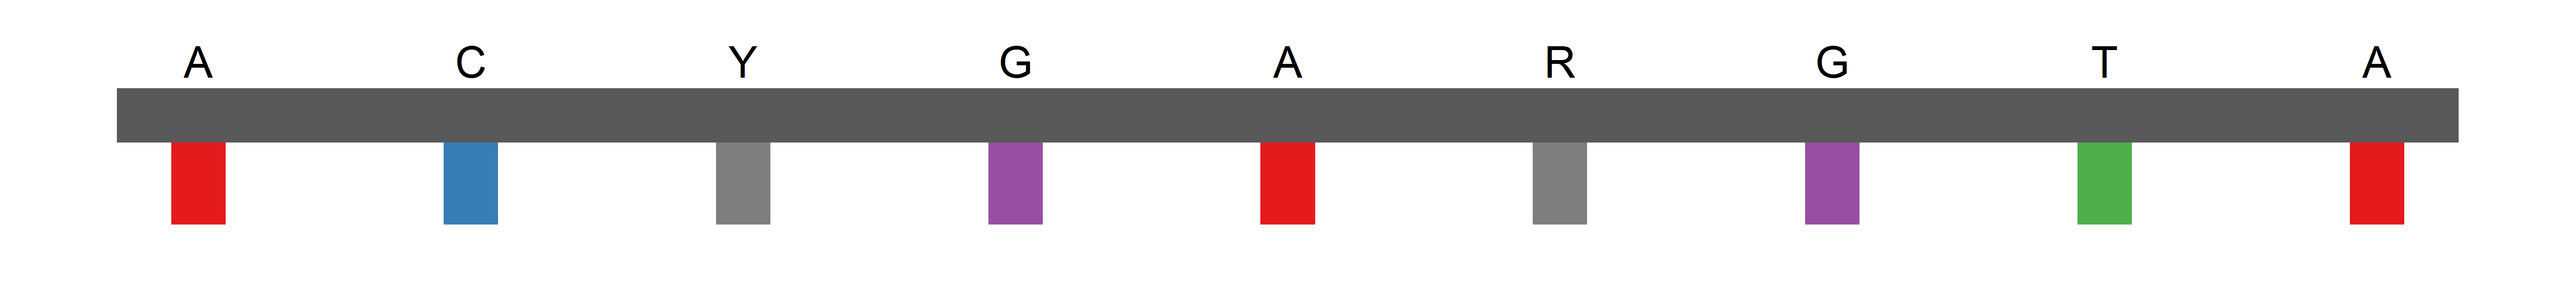
The DNAplot package provides a simple and customizable function to create aesthetically pleasing plots of DNA sequences. Each base is represented by a colored rectangle, allowing for easy visualization and analysis of sequence features.
Installation
You can install the development version of DNAplot from GitHub with:
# install.packages("remotes")
remotes::install_github("brunomioto/DNAplot")